This will help you pretty much all areas as a developer.
For example, if you want to estimate cost of your own side project before you take the time to implement and write a bunch of code, you can use this stuff to make those rough estimates and give you an idea whether it’s even profitable.
It also help you from nightmare scenario where maybe you have a small side project, and all of a sudden it goes viral and the person’s left with thousands of dollars in cloud hosting bills. This will help you to get a rough estimate of where you should setup a billing alert or shutdown the service automatically, rather than risk losing a bunch of money.
It’s also useful if you are working on a company, and you are thinking about adding a new feature, and you want to estimate how much it would cost per user to add that feature, you could do a rough estimate in that way.
It also helps you with general system design so that you know what the trade-offs are, what are the areas that are going to hurt performance of your application.
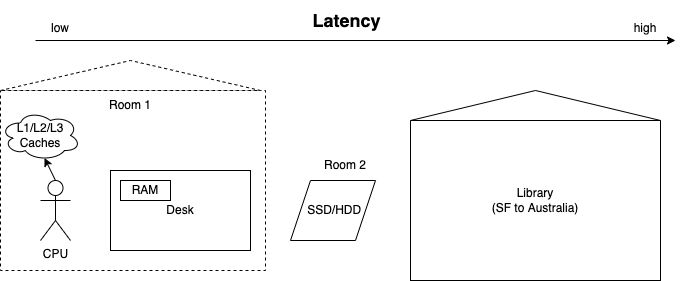
Latency Numbers
| Access Type | Time | Scaled Time |
|---|---|---|
| CPU Cycle | 0.3 nanoseconds (ns) | 1S |
| CPU L1 Cache | 1 nanoseconds (ns) | 3S |
| CPU L2 Cache | 3 nanoseconds (ns) | 9 S |
| CPU L3 Cache | 15 nanoseconds (ns) | 43 S |
| Main Memory (RAM) | 120 nanoseconds (ns) | 6 minutes |
| SSD | 150 microseconds (μs) | 6 days |
| HDD | 10 milliseconds (ms) | 12 months |
| SF to NYC | 40 milliseconds (ms) | 4 years |
| SF to Australia | 183 milliseconds (ms) | 19 years |
From above table, you can clearly see the significant difference between extracting some data from Redis (RAM-based, 120 ns) verse from SSD (150 μs) or HDD (10 ms).
For example, the shortest possible time for a request‘s round-trip time (that is, go back and forth) in a fiber-optic cable between New York to Sydney is 160ms . Distributed systems allow you to have a node in both cities, allowing traffic to hit the node that is closest to it.
Latency Key Takeaway
- Avoid Network calls whenever possible.
- Replicate data across data centers for Disaster Recovery as well as Performance.
- Use Content Distributed Networks (CDNs) to reduce latency.
- Keep frequently accessed data in memory if possible rather than seeking from disk, caching.
Common Constant Numbers
Data Conversion
| small | big | scientific notion |
|---|---|---|
| 8 bits | 1 byte | 2^3 bits = 1 byte |
| 1024 bytes | 1 kilobyte (KB) | 2^10 bytes = 1KB |
| 1024 kilobyte (KB) | 1 megabyte (MB) | 2^10 KB = 1MB |
| 1024 megabyte (MB) | 1 gigabyte (GB) | 2^10 MB = 1GB |
| 1024 gigabyte (GB) | 1 terabyte (TB) | 2^10 GB = 1TB |
| 1024 terabyte (TB) | 1 petabyte (PB) | 2^10 TB = 1PB |
| 1 million kilobyte (KB) | 1 gigabyte (GB) | 10^6 KB = 1GB |
| 1 million megabyte (MB) | 1 terabyte (TB) | 10^6 MB = 1TB |
| 1 million gigabyte (GB) | 1 petabyte (PB) | 10^6 GB = 1PB |
Common Data Types
| Name | Size |
|---|---|
| Char | 1 byte |
| Integer | 4 bytes |
| UNIX Timestamp | 4 bytes |
Time Conversion
- 60 seconds x 60 minutes = 3600 seconds per hour (36 hundreds)
- 3600 x 24 hours = 86,400 seconds per day (86 thousands)
- 86,400 x 30 days = 2,500,000 seconds per month (2.5 millions)
Capacity Estimates
Let’s use an Instagram typed app, Fastgram, as example, and we want to estimate the following aspects
- Daily Traffic
- Memory Usage
- Bandwidth
- Storage
Traffic Estimate
From traffic perspective, we want to estimate total number of requests app will receive.
So we can use following way to do the calculation: Average Daily Active Users x Average Reads/Writes per user.
For instance, if the Daily Active User (DAU) is 10 million, average viewed photo is 30, average uploaded photo is 1, then we can get:
- Daily Photo Requests = 10 million DAU x 30 viewed photo = 300 million photo requests
- Daily Photo Uploads = 10 million DAU x 1 uploaded photo = 10 million photo writes
- Viewed Photo per second (QPS) = 300 million photo requests // 86,400 seconds = 3472 Requests per Second (QPS)
- Write Photo per Second = 10 million writes // 86,400 seconds = 115 writes per second
It’ also worthy to note that one external request will probably mean more internal requests. Like the above Instagram typed app, internally you will probably used microservice architecture that one external request will invoke photo service, video service, analytics service, recommendation service, logging service etc.
Memory Estimate
To calculate memory usage, we can use Read Requests per day x Average Request size x 0.2. Here we have our assumption based on 80-20 rule, that 20% of your data will be 80% of your overall requests or traffic, especially on social media site that most of the viewed content are coming from 20% of users.
As we discussed before around latency, we definitely need to cache these 20% content in memory rather than extracting from database.
Based on the above Fastgram example, let’s say the average request size is about 500 bytes per post that contains username, description, text,etc.
- 300 million photo requests x 500 bytes = 150 GB
- 150 GB x 0.2 (20%) = 30 GB
- 30 GB x 3 (replication) = 90 GB
Here we use 3 replicas to ensure the application is highly available. We can definitely go with replication factor of 2, but it will reduce the availability of our application.
Bandwidth
We can use Request per day x Request size to calculate the daily bandwidth.
Continuing with the Fastgram app, we assume the request size is about 1.5MB, that contains the photo from CDN, and that 0.5MB around username, description, etc.
- 300 million request x 1.5MB = 450,000GB
- 450,000GB // 86,400 seconds = 5.2GB per second
Storage
As to storage to Fastgram, we can use Writes per day x Size of write x Time to store data to estimate.
- 10 million photo writes x 1.5MB = 15TB per day
- 15TB x 365 days x 10 years = 55 Petabytes (PB)
Profitable or not
With all above estimates from Traffic, Memory, Bandwidth and Storage, we can quickly calculate the cost per user. If you have your analytics functions, we can quickly calculate how much money we make per user, how much money we make based on ads. You can then bring these data points to your decision-making process.